Evolving Standard Validation Practices for Traffic Data
Part Two: Examining the Data
Previously, we compared two common industry practices of using one- or two-day counts for traffic validation against counts for an entire year. Doing so with over 100 intersections in the City of Roseville, CA, suggested that a larger data sample overcomes the limitations of those standard practices and provides more accurate traffic estimates and insights into potential variations.
In this second post, we examine StreetLight as a possible source for larger samples of estimates for turning movement volume. To accept any new data source as accurate and reasonable, it needs to be validated. Below we share our detailed examination and methodology for validating the StreetLight Volume estimates against the City of Roseville counts, as well as our insights on applying adjustment factors to the StreetLight Volume estimates for greater accuracy for projects in suburban areas. Interested in talking more about applying larger sample sets for capacity decisions or suburban projects, contact us.
Behind the Validation
StreetLight performed their own validation of their traffic volume estimates and shared documentation from third-party validations.[1] Fehr & Peers contributed to this validation work through original research, assessing StreetLight’s turning movement volume and vehicle miles of travel (VMT) estimates in two separate validation efforts.[2]
To increase confidence in the use of StreetLight’s turning movement volume estimates, this new validation utilizes a much larger intersection turning movement volume database from the City of Roseville. This robust database provides the opportunity to directly compare and statistically validate StreetLight’s turning movement volume estimates. Further, in comparison to one- or two-day counts, the data also allows exploration of the impact of COVID-19 on traditional traffic patterns, which will be covered in a later blog post.
We collaborated on best practices with StreetLight throughout the validation process, including their recommendation for the minimum sample size and recommended approach for validation.
To compare against the Roseville count data, we downloaded StreetLight turning movement volume estimates from StreetLight’s platform, StreetLight Insight® for all 107 intersections at 15-minute intervals. This data was aggregated for average weekdays (Tuesdays-Thursdays) using two-month date ranges (January – February, March – April, etc.). These date ranges were used to ensure there were enough days in both the StreetLight sample and City of Roseville counts to perform statistical tests at the turning movement level.
For a subset of intersections, we also downloaded StreetLight Metrics in two-week intervals. These intersections were chosen because they were shown to have large variations in volume over the course of the year (such as intersections near Roseville’s regional shopping mall that have large spikes in traffic near the holidays). The statistical validation showed that the two-week datasets performed worse than the two-month datasets in every test, so the rest of this post will focus on the two-month dataset.
Approach
The following approach was used for each 15-minute turning movement at each intersection. For every 2-month period we had approximately 20-24 Tuesday-Thursday counts, and one averaged StreetLight Volume estimate.
First, we calculated the 5th and 95th percentiles for count data. These are the bounds that helped us determine whether the StreetLight Volume estimate differed statistically from the count data, depending on whether the StreetLight estimate fell within the range defined by the 5th and 95th percentiles of count data.
Then, we determined bounds for whether the StreetLight Volume estimate differed practically from the count data. In an effort to avoid volume estimation errors that could have led to erroneous conclusions about capacity needs at an intersection, we used rule of thumb lane sizing bounds to test whether the actual difference between the count and StreetLight’s estimate were more than 400 vehicles per hour for left turns, 900 vehicles per hour for through movements, or 250 vehicles per hour for right turns.
Note: These values are subjective and would vary by jurisdictional context. For example, in this study area most signalized intersections involve four- or six-lane roadways. Smaller roadways would warrant reductions in these volume thresholds. Further validation may use a more conservative set of numbers for the practical bounds.
We incorporated both statistical tests and practical tests, as sometimes there can be large percent differences at small volume intersections that indicates a significant statistical difference but does not make a practical difference. For example, a 50% different for a through movement of 70 cars is only 35 vehicles, which does not make a significant difference for analytical use of the data.
Graphs
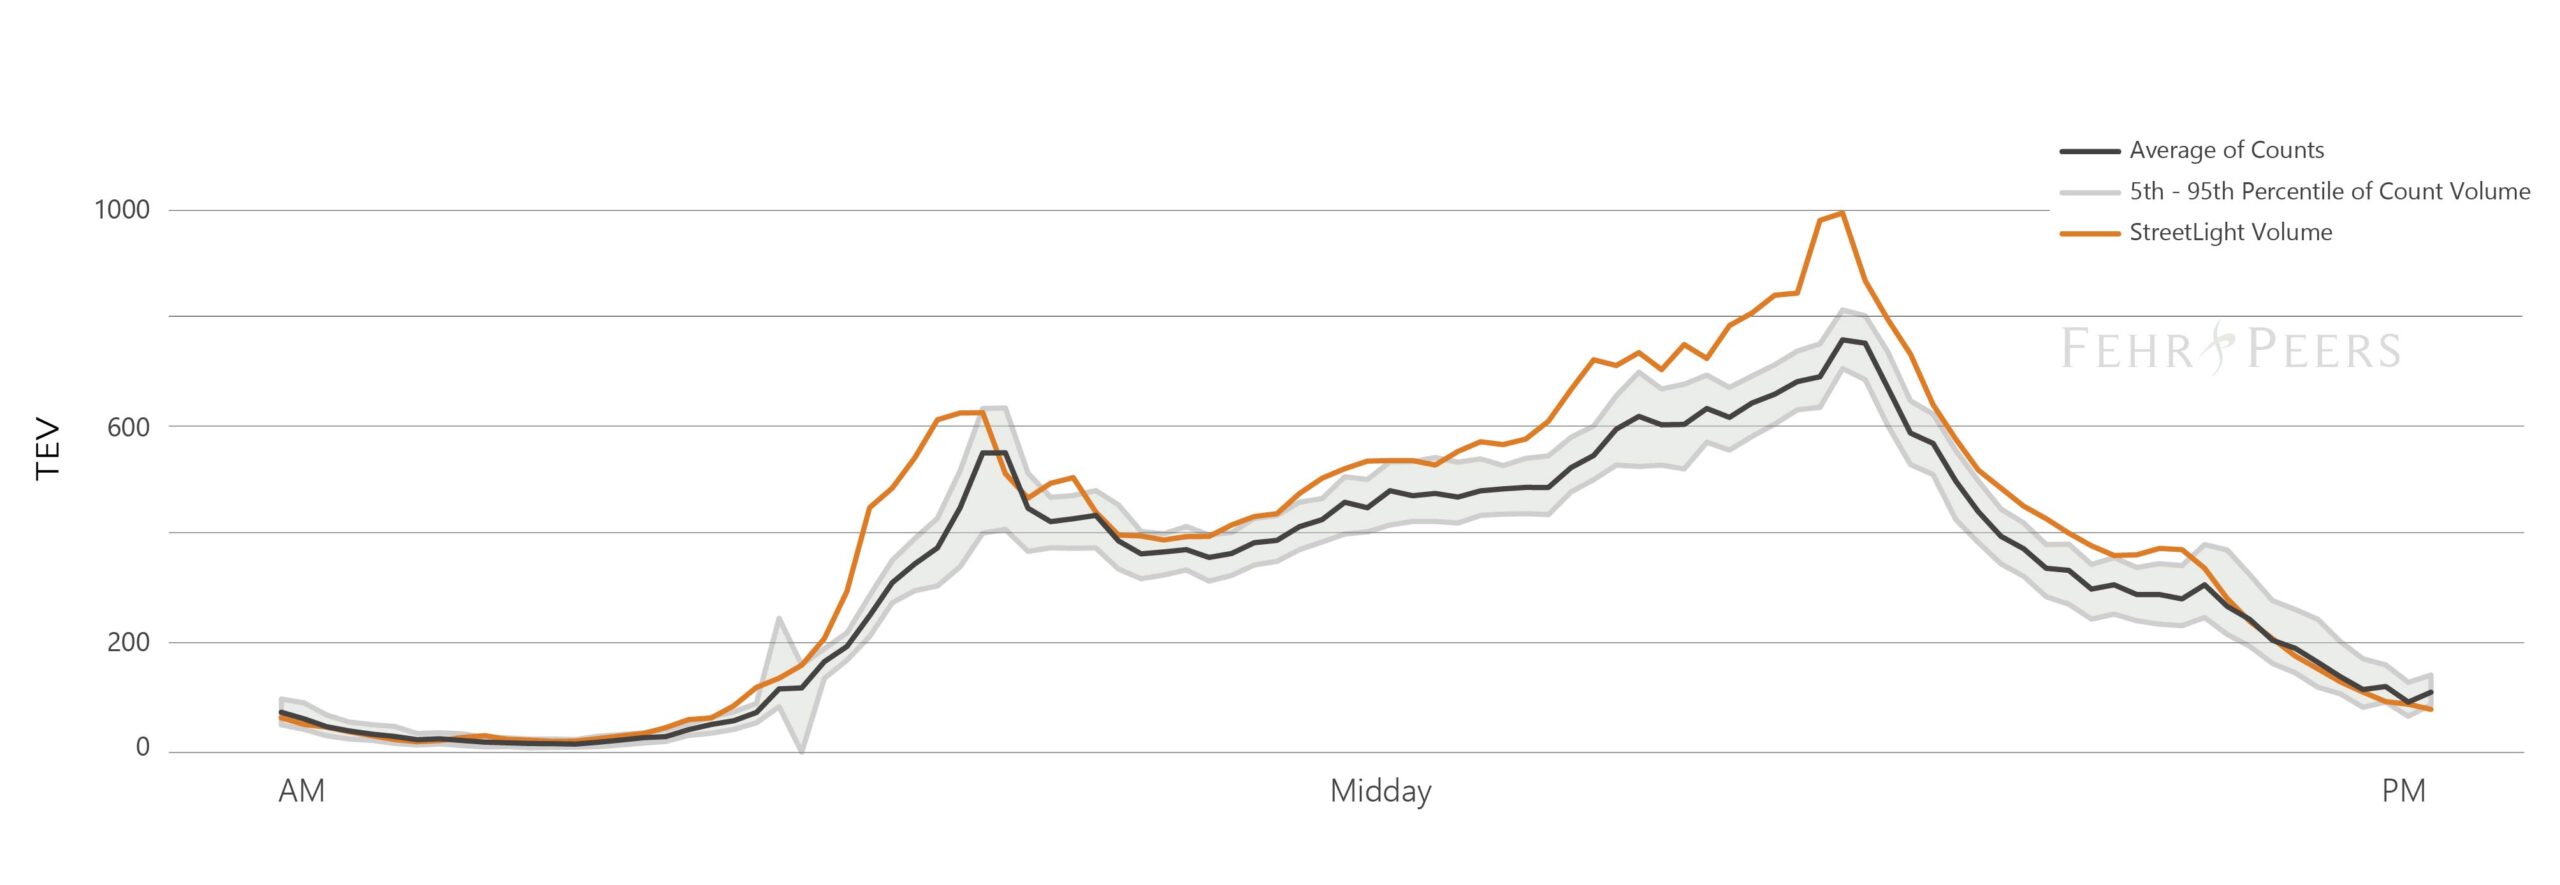
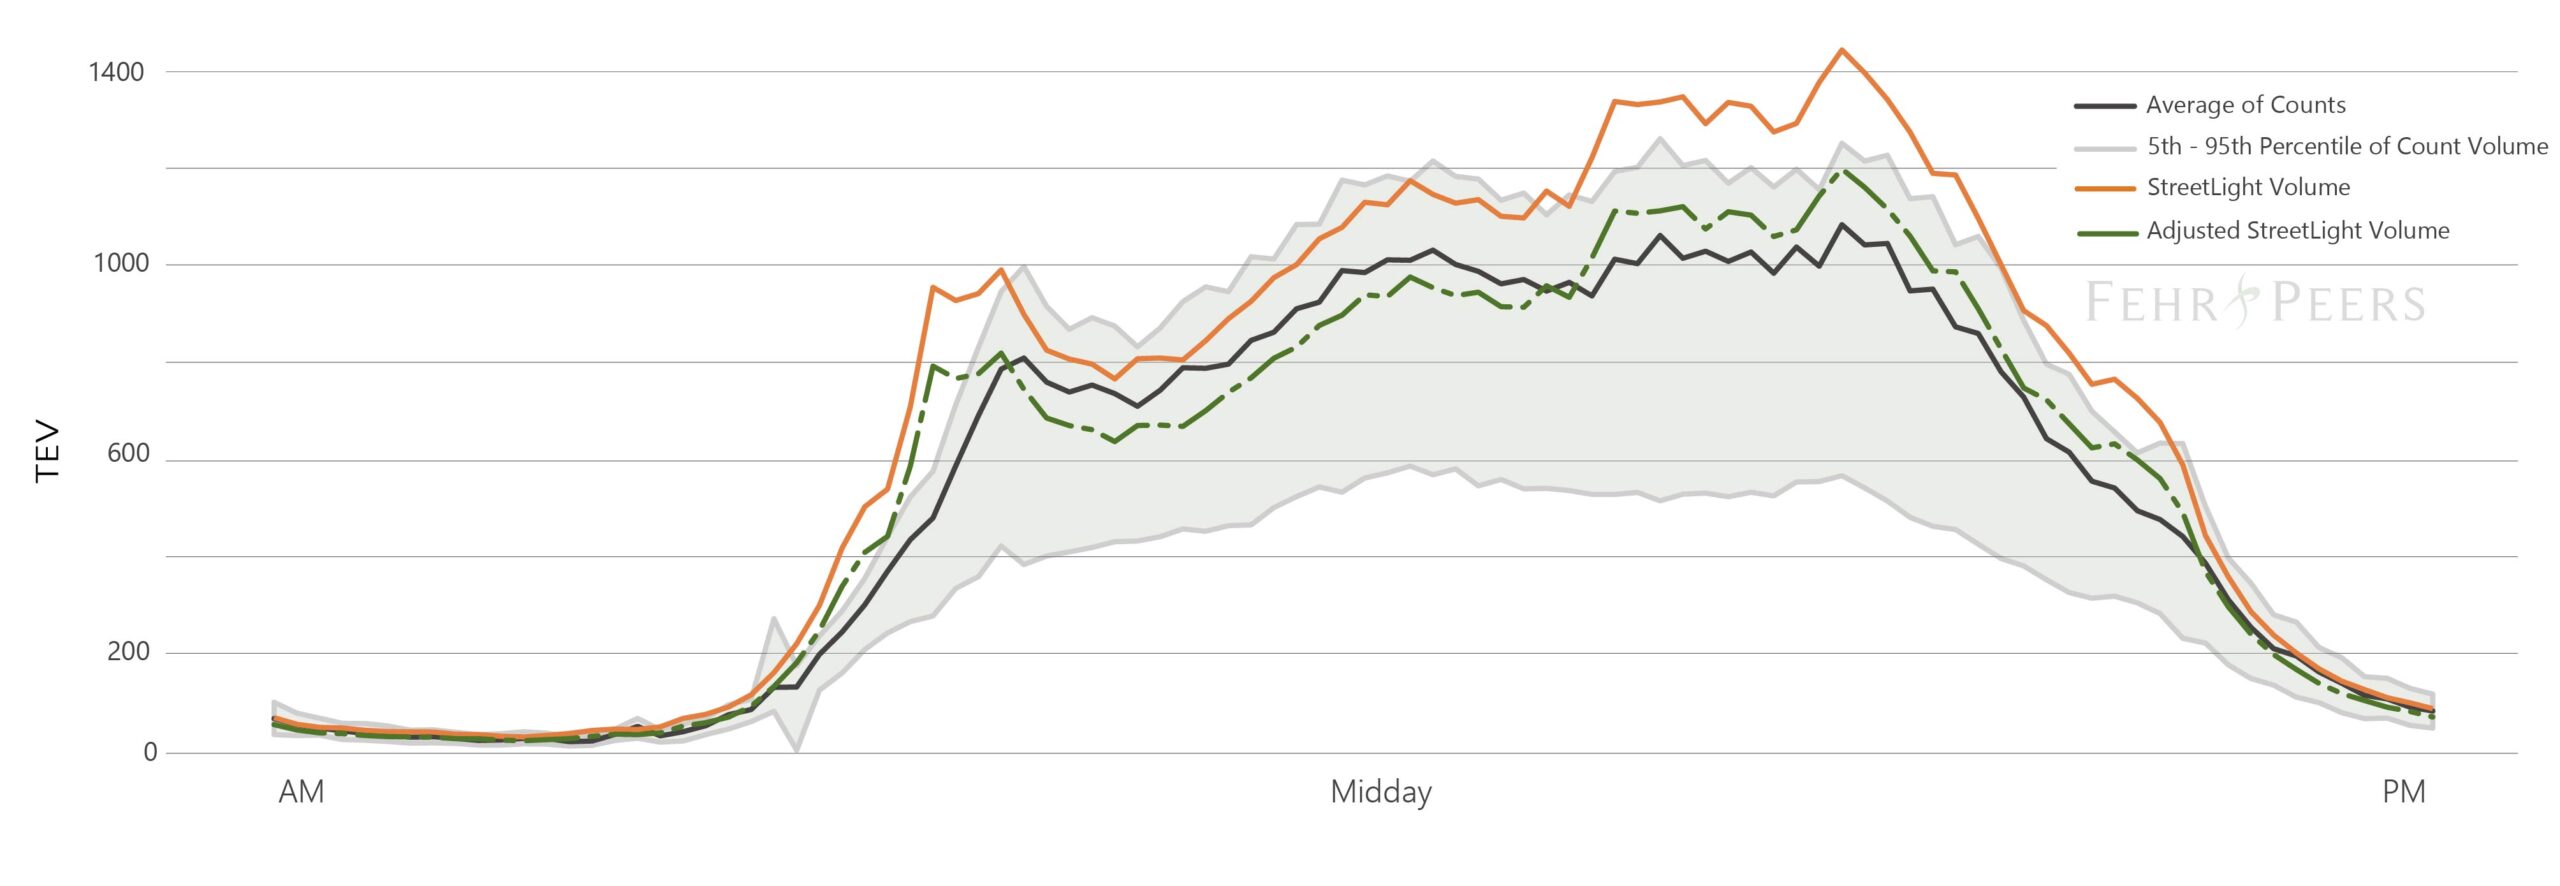
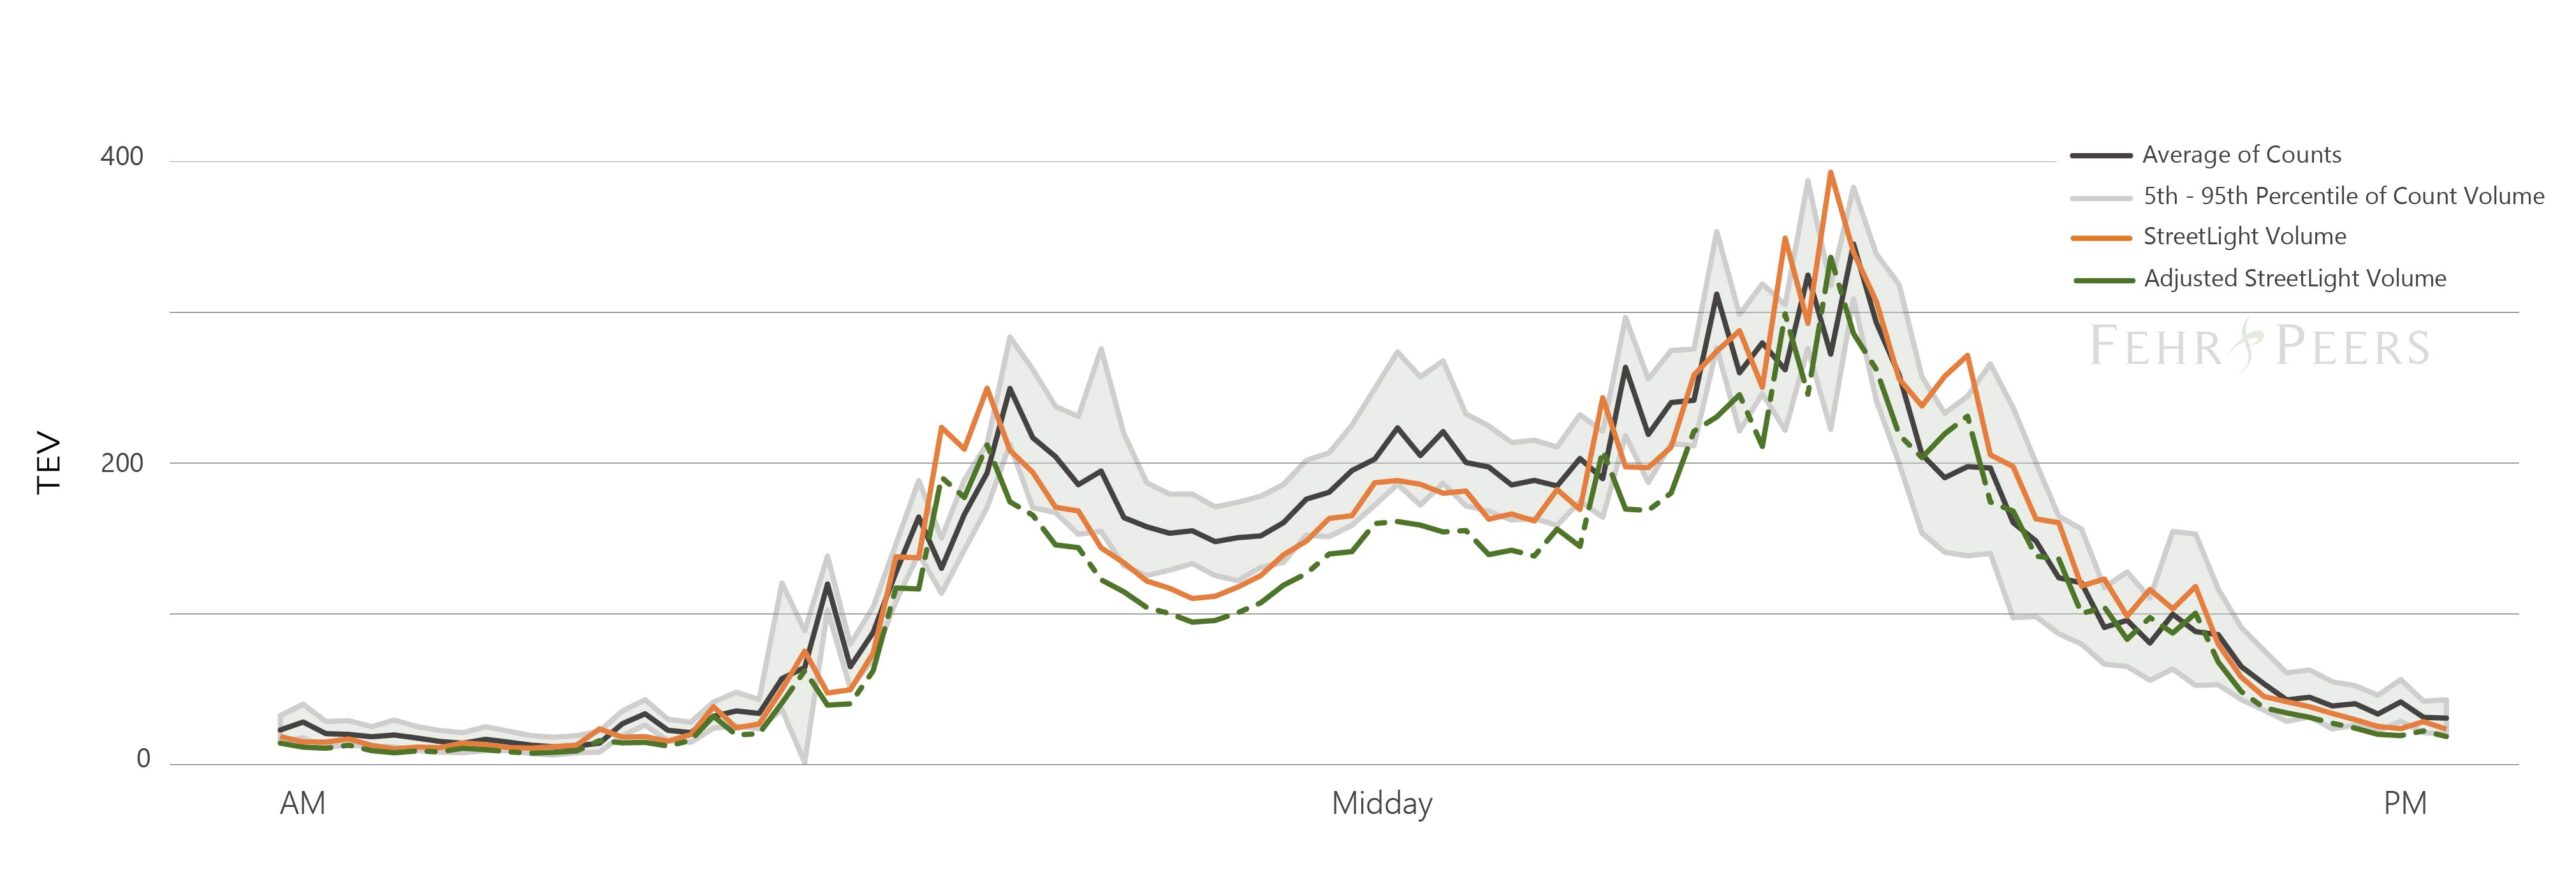
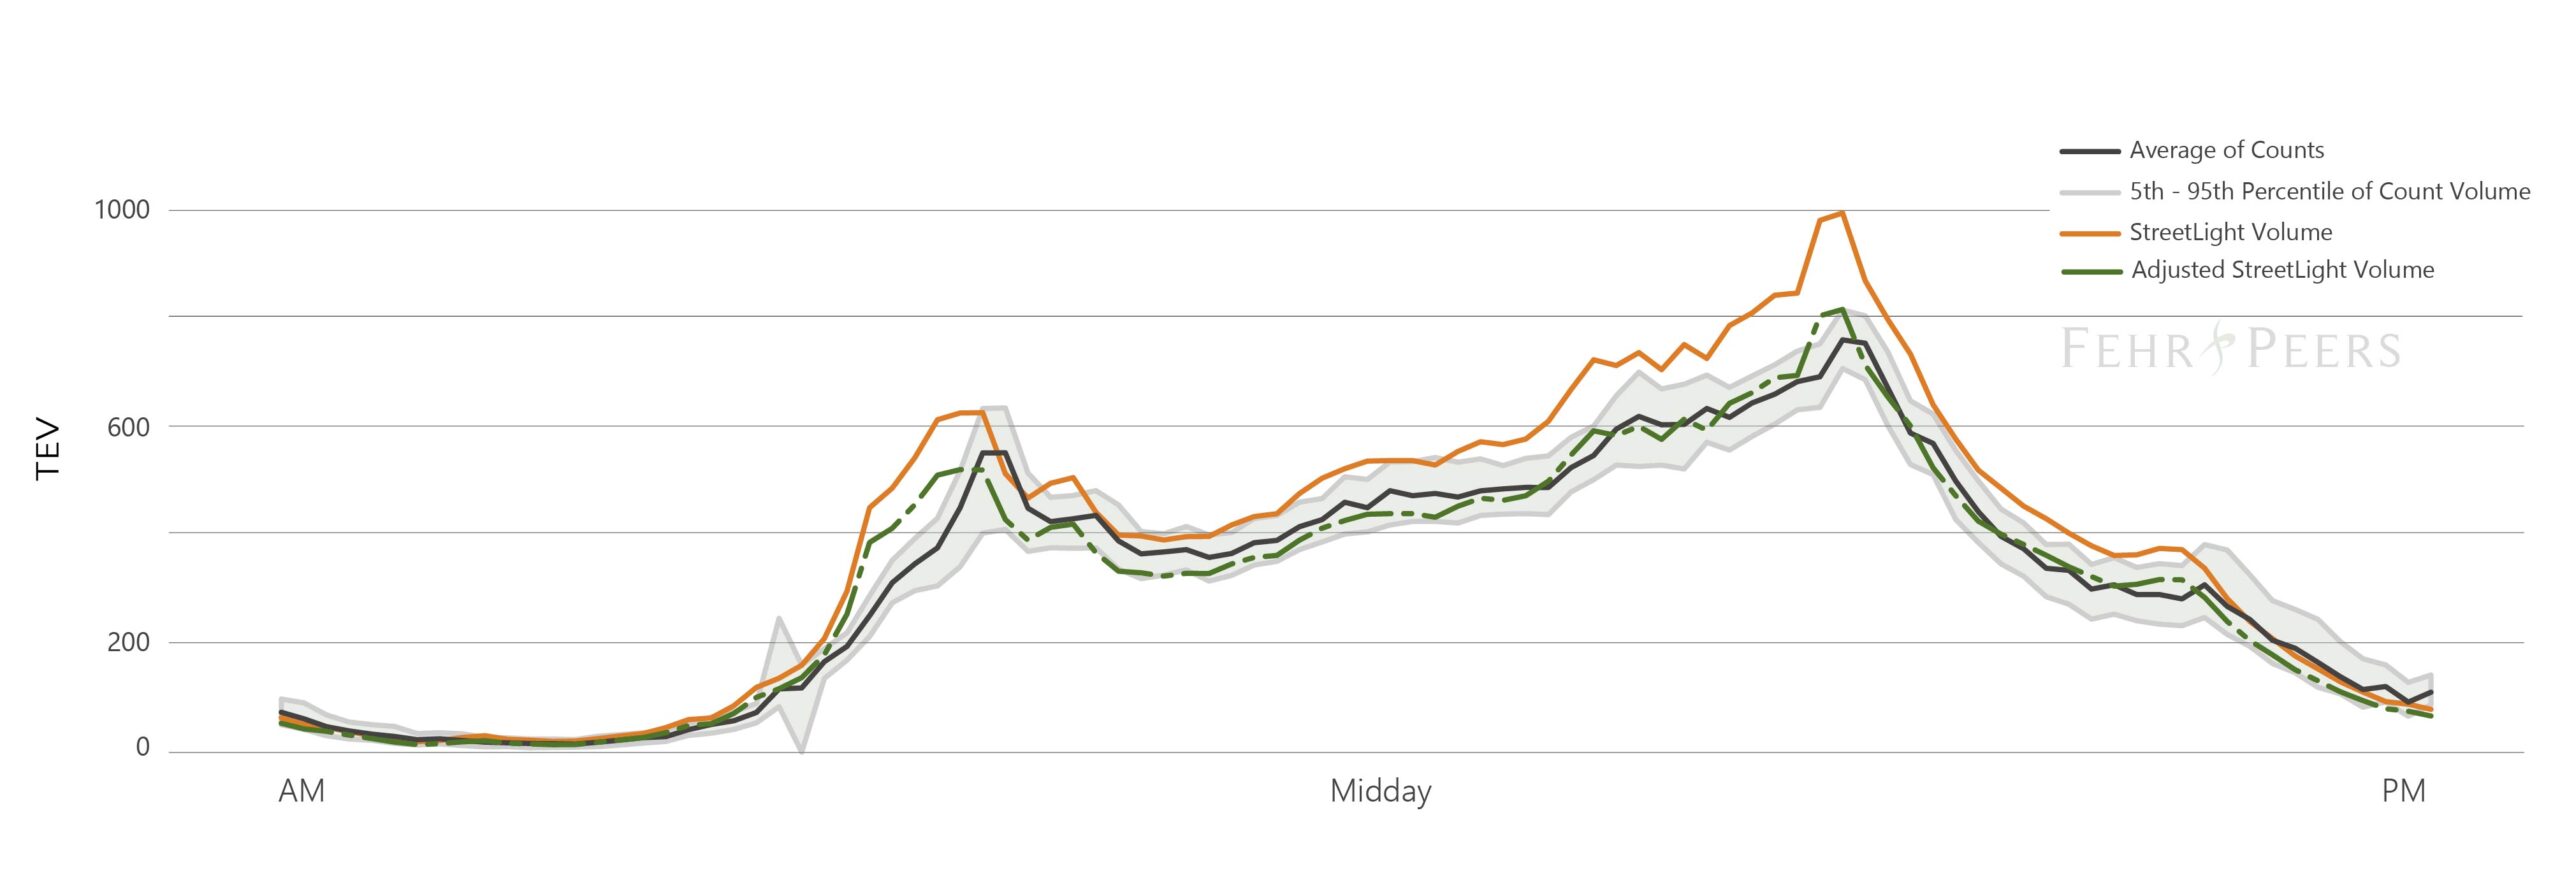
In part one, we graphed the full year of count data, and showed the range of observations and count average by time of day. Using the same example intersections, we have graphed the average of the count data, the 5th and 95th percentile of the count data, and the average StreetLight Volume estimate for all weekdays in the year. The graphs show that the StreetLight Volume estimates tend to be overestimates, especially during peak hours when traffic volumes are the highest.
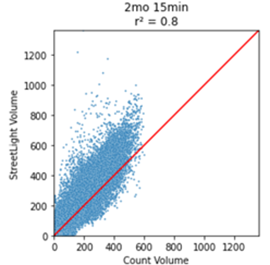
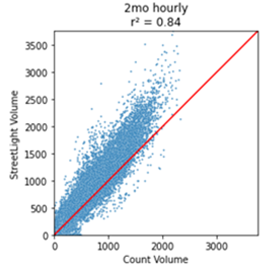
We also created scatterplots, which represent each turning movement at all 107 intersections. They show the StreetLight Volume estimate on the y-axis, and the count data on the x-axis. The data was also aggregated up from the 15-minute intervals to compare at the hourly level. In general, the StreetLight Volume estimates were about 20% higher than the count data. While the StreetLight Volume estimates are well correlated to the observed counts, especially at higher volumes, there is a clear pattern of overestimation.
Statistical Findings
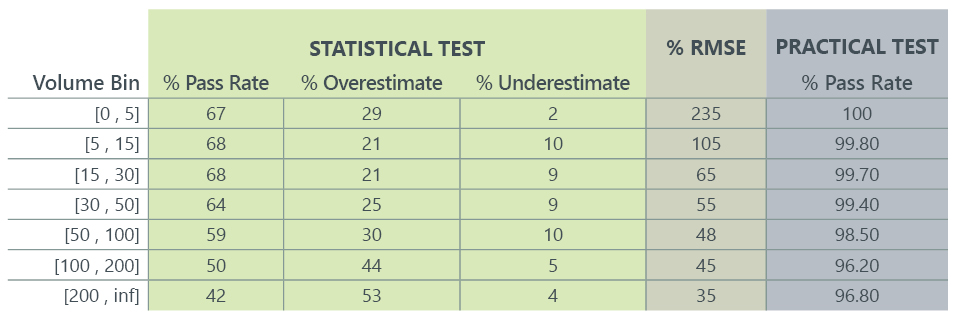
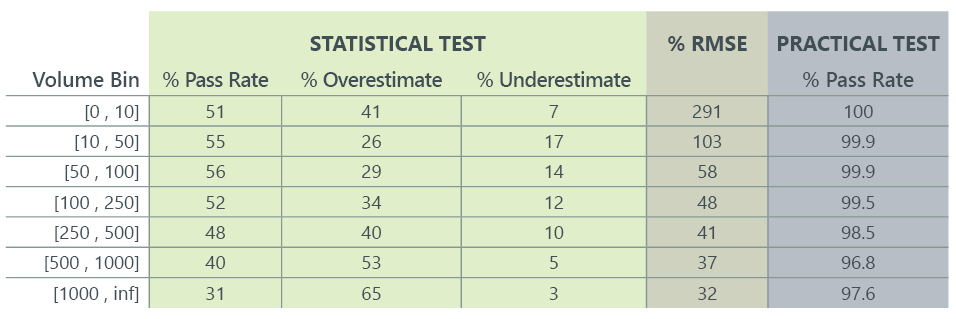
When we compared the Streetlight estimates to the 5th and 95th percentiles of the observed counts, we found that as the count volume increased, the StreetLight Volume tended to be an overestimate, which aligned with the scatterplots above. The tables below show the percentage of StreetLight volume estimates that passed the statistical test by volume bin, and if the movement didn’t pass, whether the StreetLight Volume estimate was an over- or under-estimate. The table also includes the practical tests described in the approach above.
Overall, the higher volume bins have a lower test pass rate compared to the lower volume bins. This is because the higher volume bins have a narrow range that determines pass or fail (we refer to this range as pass width). The pass width represents the day-to-day variation in the count, and the variation is smaller (in terms of percentage) for counts in the high-volume bin, which is to be expected. In the tables below, the statistical pass rates show that as the count volume increased, the percentage of movements that StreetLight overestimated also increased.
So, how much is StreetLight overestimating by, and is the error at these volumes statistically significant? To answer that, we calculated percent RMSE of the StreetLight turning movement estimates by volume bin for the 15-minute data and the aggregated hourly volumes. Percent Root Mean Squared Error or RMSE is the square root of the volume estimates minus the actual count squared divided by the number of counts. It is a measure like standard deviation in that it assesses the accuracy of the StreetLight Volume dataset by calculating the magnitude of error between the volume estimate and the count.
At the hourly level for the 2-month data, the percent RMSE is around 30-40%. This percent RSME is consistent with allowable error for travel demand models. Caltrans provides Regional Transportation Plan guidelines which specify that percent RMSE on model links should be less than 40%, which is also supported by the FHWA Model Validation and Reasonableness Checking guidelines. [3, 4]
StreetLight’s volume estimates passed the practical test for the 15-minute and hourly data, which shows that the estimates likely will not lead to erroneous intersection capacity decisions in this particular jurisdiction where most traffic operations analysis is being performed for arterials with four or more lanes.
Understanding Pass Widths by Volume
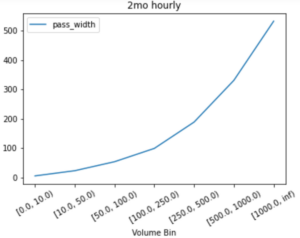
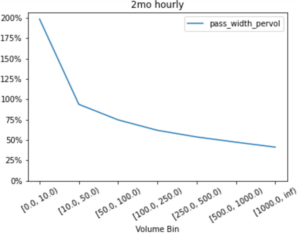
We investigated the size of these confidence intervals to understand how large of a range the count data provided in order for the corresponding StreetLight estimate to pass our statistical test.
As turning movement volume increased, the absolute size of the confidence interval increases since higher volume intersections are expected to have larger variations in traffic volumes. However, when viewing the size of the confidence interval as a percentage of the movement volume, the relative width of the interval decreases.
Volume Adjustment
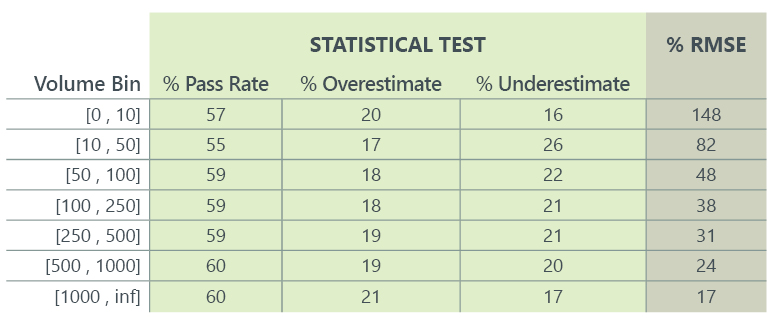
Looking at these results, we discussed ways to improve the StreetLight Volume estimates. We decided to use this large dataset to create our own adjustment factors by volume bin for both the 15-minute and hourly data. After calculating and applying these adjustments factors to the StreetLight Volume estimates, we obtained the following results:
At the hourly level, the percent RMSE shows a large improvement, and decreases from 30-40% at the largest volume bins, down to 17-30%. The adjustment also improved the StreetLight Volume estimates across all time periods as shown in the intersection examples below.
For the statistical pass rate test, the volume bins above 500 vehicles per went from a 30-40% pass rate, up to a 60% pass rate. The number of movements being under- and over-estimated are now a more equal percentage, and across every volume bin the percentage of passing movements is higher than 50%. These calibration factors for the 15-minute and hourly volume bins are shared internally within Fehr & Peers, and projects can choose to incorporate them on other projects in a suburban area. Some projects may choose to use this analysis framework to create more localized calibration factors for their market area.
Adjusted Graphs
The following intersection graphs show the same data displayed at the beginning of the blog post, but also overlay the adjusted StreetLight Volume estimates. This validation indicates that StreetLight Volume estimates are well correlated to observed count data in this suburban jurisdiction, but trend towards overestimation without use of localized adjustment factors.
____
[1] https://www.streetlightdata.com/whitepapers/
[2] https://www.fehrandpeers.com/transformative-data-collection-solution/ and https://www.streetlightdata.com/sb-743-vmt-solutions/
[3] https://dot.ca.gov/-/media/dot-media/programs/transportation-planning/documents/f0009312-2017rtpguidelinesformpos-a11y.pdf
[4] https://www.fhwa.dot.gov/planning/tmip/publications/other_reports/validation_and_reasonableness_2010/fhwahep10042.pdf


