Focusing on VMT Metrics through a Microscope
Seeing Differences Clearly
Focusing on VMT Metrics through a Microscope
Seeing Differences Clearly
Reader alert: Content may be a little wonky.
Recent news articles have highlighted the changes in driving since the pandemic, noting that congestion and vehicle miles of travel (VMT) is surpassing pre-pandemic levels. VMT estimates from StreetLight Data revealed a general increase in total VMT of 12 percent nationwide between May 2019 and 2024. Some metro areas like San Francisco and Los Angeles showed contrarian declines, which raised questions about why.
Adie Tomer, a senior fellow at Brookings Metro, was quoted by Bloomberg as saying that VMT changes could result from multiple factors:
“Declines in VMT could be a result of deliberate urban planning and infrastructure changes to rein in driving. They could also be a consequence of remote work policies and population shifts, not only away from the metro area but within it.”
Part of the challenge of knowing the cause can stem from the data itself. The StreetLight VMT estimates are based on ‘Total VMT’ derived from vehicle segment-level travel in a metro area. All travel on a given link, including many different types of trips, was packaged into the reported VMT value. To allow more intuitive comparisons between core-based statistical areas (CBSAs), this total number was then divided by the number of residents to create a ‘VMT/capita’ but no trends or subcomponents were included. Capita in this metric refers to the resident population. Therefore, the ‘VMT/capita’ value measures the total segment-level VMT in a given geography to the residential population of that same geography, regardless of who generated the VMT (resident, visitor, passer-through) or why.
The reported ‘VMT/capita’ metric is not the same as ‘VMT generated per resident’ and has limited explanatory power with respect to how or why individual travel behavior has changed post-pandemic. This proliferation of metrics has become a common challenge in VMT analysis where metrics are still evolving due to new laws like Senate Bill (SB) 743 in California.
VMT as a Metric
VMT metrics can take many forms, depending on the type of project or impact analysis. Some of the more common forms are explained in the lexicon below:
Total VMT
Total VMT Generated by a Project
Total VMT per Employee
Home-Based VMT per Resident
Total VMT per Service Population
Work Tour VMT per Employee
Residential VMT per Resident
Total VMT per Land Use Unit
Home-Based Work (HBW) VMT
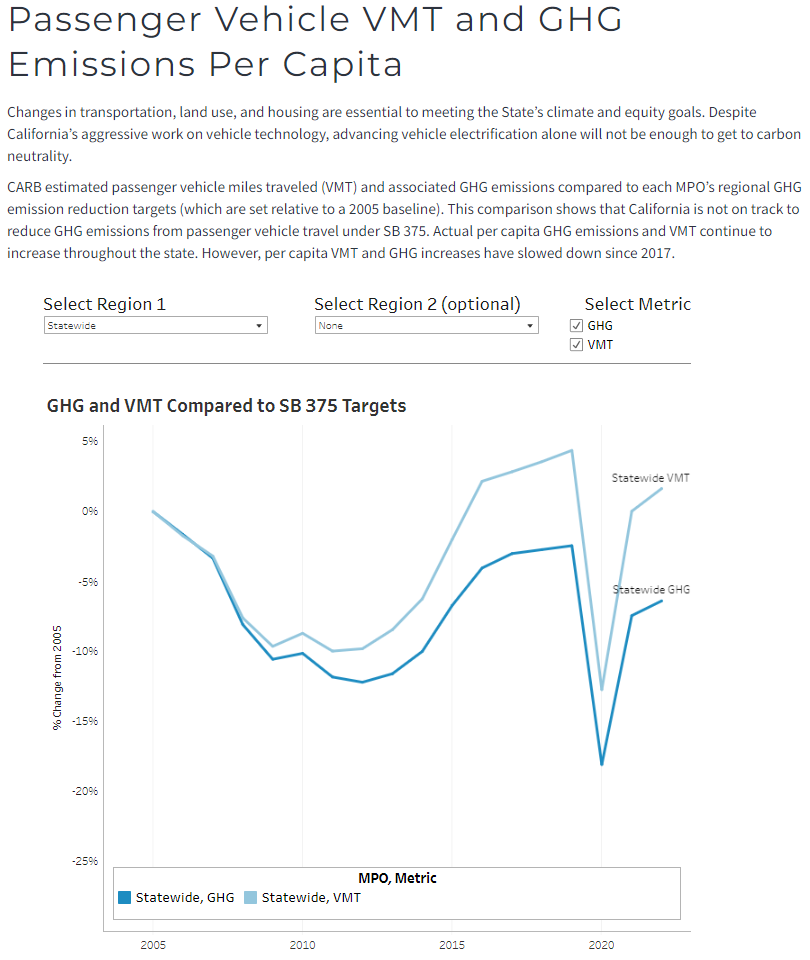
Data vendors like StreetLight Data and Replica can help explore how VMT generation rates are changing over time. For the VMT+ tool, Fehr & Peers developed home-based VMT per resident and home-based work VMT per employee rates for 2019 and 2022 using StreetLight estimates. Other metrics like household generated VMT per capita are available from Replica. As VMT generation rates, these metrics help examine the household components of the VMT story. For example, when we strip away the visitor, external worker, commercial vehicle, and passing through activity, VMT+ shows that home-based VMT per resident increased in San Francisco from 12.95 to 13.30 between 2019 and 2022. Likewise, Los Angeles increased from 16.8 to 16.98. These metros have been highlighted in news stories tied to the original StreetLight report that they experience some of the largest overall VMT reductions. Some stories advanced theories that the reductions were due to California’s new laws and regulations tied to reducing VMT and greenhouse gases (GHGs). In reality, metrics measuring the household VMT generated per capita consistently show increases in California despite the legal and regulatory framework designed to reduce household driving. In addition to VMT+ estimates at the household level, the California Air Resources Board (CARB) tracks overall passenger vehicle VMT generated per capita (see graphic below). The trend was clearly higher before the pandemic and for large metros like San Francisco and Los Angeles held through the pandemic per the VMT+ data noted above.
Source: California Air Resources Board. Data through 2020.
So why did Total VMT from the StreetLight report decline? Total VMT has declined due to less travel activity from workers, commercial vehicles, and visitors (and possibly an overall reduction in population since 2019). The same article revealed that neighborhood sales tax revenues were down by as much as 25 percent and that visitor travel was struggling to return to pre-pandemic levels. So fewer workers and visitors means fewer trips to offices, bars, restaurants, and shops, resulting in lower total VMT on the network. If this VMT value is simply divided by the resident population, then a decline is expected but that does not explain the VMT generation changes of the resident population. Clearly, a careful examination of the many factors influencing VMT is needed to understand how and where both policies and household choices are changing travel outcomes.
https://www.fehrandpeers.com/vmt-impacts/
https://www.fehrandpeers.com/sb743/
https://storymaps.arcgis.com/stories/e9fb17d33a2c4d60a6747071be3d5b4a
https://www.streetlightdata.com/vehicle-miles-traveled-vmt-monitor-by-county/
https://www.replicahq.com/2023-vmt-rankings

Ron Milam
Forecasting Practice Leader

Marissa Milam
Senior Engineer/Planner

Mike Wallace
Forecasting Practice Leader


